Minnesota is comprised of complex combinations of predominantly glacially-affected landscapes. A careful understanding of these landscapes and component landforms is crucial to developing a complete understanding of a soil and site for septic system evaluation.
Minnesota's soil training regions
When selecting a workshop location for soils continuing education we suggest registering in a location that has similar soil parent material to where you live or work. While you can attend anywhere in the state, Minnesota’s soil is complex and different regions of the state may have different soil characteristics. Use the Minnesota's soil training regions map to determine which location has soil most like where you typically work.
How to...
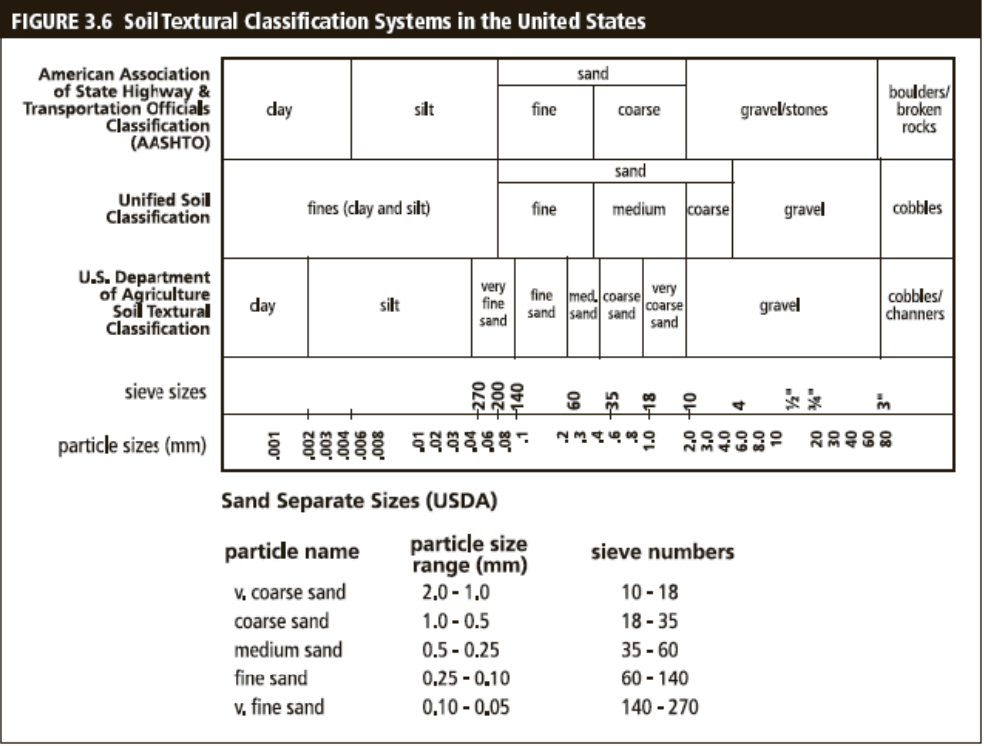
How to run a sieve analysis for SSTS sand analysis
- Collect, crush and dry sample (air dry 24 hours or longer).
- Determine weight of entire sample and record.
- Sieve sample with a #10 sieve. Material that does not pass through this sieve is non‐soil material (rock) according to USDA texturing.
- Weigh the amount of material on the top of the #10 sieve – this is the % rock in the sample.
- Weigh the soil that passed through the #10 sieve and record. This is the entire sample of soil materials.
- Sieve sample with a #35 sieve. This sieve separates the coarse and very coarse sand from medium sand and finer particles.
- Weigh the soil that remains on top of the #35 sieve – this is the % coarse sand in the sample. % coarse sand = (weight on top of #35 sieve/weight of soil passed through #10)*100
- Sieve sample with a #60 sieve. This sieve separates the medium sand from the finer particles.
- Weigh the soil that remains on top of the #60 sieve – this is the % medium sand in the sample. % medium sand = (weight on top of #60 sieve/weight of soil passed through #10)*100
- Sieve sample with a #270 sieve. This sieve separates the fine and very fine sand from the silts and clays.
- Weigh the soil that remains on top of the #270 sieve – this is the % fine and very fine sand in the sample. % fine sand = (weight on top of #270 sieve/weight of soil passed through #10)*100
- Proceed to "Determining the sand textural classification" below
Determining the sand textural classification
- If the coarse sand is >25% and there is less than 50% medium sand or fine and very fine sand, then the sample is coarse sand.
- If the coarse sand (cannot exceed 25%) + medium sand is > 25% with <50% fine sand or very fine sand, then the sample is medium sand.
- Any other combination of sand sizes not meeting 1 or 2 above, is not coarse sand or medium sand.
- A soil texture calculator is also available from the USDA‐NRCS. Note that it requires portioning of the sand into each of the sand sizes (very coarse, coarse, medium, fine and very fine sands)
How to use the web soil survey
Soil surveys have entered a new era across Minnesota and the United States. The official soil survey information and documentation now resides online. While users may choose to print off information, this information is subject to change and should be checked online frequently for updates.
Online soil surveys still present soil lines on a photographic background indicating the boundaries between different soil types. These maps show the occurrence and distribution of each kind of soil.
For counties that do not have published soil surveys, the county Soil and Water Conservation District office can often provide soils information.
Locate the site on the survey (GPS coordinates, county, address, township, range, section, or simply zoom) and determine what soil map units exist on the parcel:
- Outline the desired parcel/area using the Define AOI (Area of Interest) tool.
- Once the AOI has been defined, select the tab for "soil map" near the top of the browser window.
- You will now see a display of the aerial photograph with soil lines over the top. On the left of the map (legend), you will see a summary of map units, map unit names, acres in the AOI and percent composition of the AOI. Map units are denoted by symbols such as 401C.
- List the map unit symbols found at your location.
- Selecting the third tab entitled "soil data explorer" allows the mapping of selected soil properties over the AOI.
- Now select the "suitabilities and limitations for use" tab.
- Under this tab, there is a suitabilities rating for "sanitary facilities." Select this rating.
- Under this rating, there are numerous interpretations. The five interpretations we are interested in include
- Septage Application ‐ Incorporation or Injection (MN)
- Septage Application ‐ Surface (MN)
- Septic Tank Absorption Fields ‐ At‐Grade (MN)
- Septic Tank Absorption Fields ‐ Mound (MN)
- Septic Tank Absorption Fields ‐ Trench (MN)
- Select the "View Ratings" button to view map of ratings with tables of soil map units and their individual suitabilities.
- Note: this does not replace recording of specific soil properties, which are required by Minnesota Rule Chapter 7080.1700 (as discussed above). To determine these properties, either select the "soil reports" tab and access the desired/required information from the selected reports. Alternatively, you may search individual soil series' properties by accessing the Official Soil Series Descriptions (OSD) website and searching for soils by their specific soil series name as determined from the AOI legend on the web soil survey.
How to run a percolation test
Successful design of an on-site sewage treatment system depends on adequate site evaluation. The percolation test is only a small part of a complete site evaluation. Refer to "how to run a percolation test", for the complete site evaluation procedure.
Suitable soil is the key to providing adequate on-site sewage treatment. Soil that is too coarse will not do a good job of moving nutrients and bacteria. Loam or clay loam soil will do an excellent job of nutrient and bacteria removal but will require a relatively large soil treatment area. Seasonal saturation of a soil will cause sewage to back up if the trenches are constructed too deep.
1. Use soil borings to locate a suitable area
Soil borings should be at least 3 inches in diameter and at least 3 feet deeper than the bottom of the proposed soil treatment system. A boring may stop as soon as there is evidence of seasonal soil saturation or bedrock. Number the soil boring holes and locate them on a scale map of the site.
Evaluate the soil texture (sand, loamy sand, sandy loam, loam, silt loam, clay loam, etc.) for every foot of depth or at least where a change in soil texture occurs (Figure 1). Record this data on a log sheet of the boring hole. If you encounter seasonally saturated soil or an impervious layer (rock or clay) at a depth of 3 feet or closer to the ground surface, the area is not suitable for a subsurface soil treatment unit. A sewage treatment mound, however, could be installed at such a location if other factors were suitable.
Seasonal saturation of soil is indicated by a gray color together with red streaks or splotches and is called mottling. The bottom of the drainfield trench should be located no closer than 3 feet from the mottled soil. Even though the hole may be dry when you make the soil boring, the soil will be saturated during wet conditions and during the operation of the sewage treatment system. The system will fail in clay soil or inadequately treat sewage in coarse soil.
The lawn area required for the soil treatment unit depends on the percolation rate of the soil (soil texture) and the amount of sewage discharged by the proposed or existing residence. Refer to your local sanitary code for required setbacks from buildings, property lines, water supply wells, etc. Take at least four soil borings in each soil texture in order to locate lawn area of adequate size.
2. Make an adequate number of percolation test holes
If the soil texture is uniform over the selected site, use at least two and preferably three percolation test holes. If the soil texture changes within the site, make at least two percolation test holes in each soil texture. Space the percolation test holes uniformly over the area proposed for the soil treatment unit.
3. Dig test holes
The test holes should be round and at least 6 inches, but no larger than 8 inches, in diameter. Dig each test hole as deep as you intend to excavate the soil treatment trench. The bottom of the percolation test hole must be at least 3 feet above the level of seasonally saturated soil or bedrock. A clam shell-type posthole digger can be used (Figure 2). If you use a 6-inch auger, it's a good idea to drill a pilot hole with the 3-inch auger. Observe and record the soil texture as the percolation test hole is being dug.
4. Prepare the percolation test holes
The auger or posthole digger is likely to smear the soil along the sidewalls of the test hole. Therefore, the bottom 12 inches of the sidewalls and the bottom of the hole should be scratched or scarified with a sharp, pointed instrument such as a knife. Nails driven into a 1 x 2-inch board as shown in Figure 3 will do a good job of scarifying the hole to provide an open, natural soil into which water may percolate. Remove all loose soil material from the bottom of the test hole. Add 2 inches of one-fourth to three-fourths inch gravel to protect the bottom from scouring when water is added. The gravel can be contained in a nylon mesh bag as shown in Figure 4 in order to be removed after the test is performed and used for additional percolation tests.
5. Distinguish between soil saturation and soil swelling
Saturation means that the voids between soil particles are full of water. This can happen in a short time. Swelling is caused by intrusion of water into individual soil particles. This is a slow process, especially in clay soils, and is why a prolonged soaking period is necessary for some soils.
Carefully fill the percolation test hole with clear water to a depth of at least 12 inches above the soil bottom of the test hole. Use a hose to prevent the water from washing down the sides of the hole or add the water directly into the percometer as shown in Figure 6. A 6-inch diameter hole requires about 1.5 gallons per foot of depth.
Sandy soil containing no clay does not swell. The percolation test may proceed immediately if the 12 inches of water seeps away in 10 minutes or less. The percolation test procedure for sandy soils is described under step 6C.
For prolonged soil soaking, keep the 12-inch depth of water in the hole for at least four hours, and preferably overnight. Add water as necessary. You may use an automatic siphon or valve to maintain the 12-inch water depth (Figure 5). A valve made from the carburetor of a small engine is shown in Figure 7.
6. Measure percolation rate
Except for sandy soils, make the percolation rate measurements the day after completing step 5.
- If there is more than 6 inches of water in the hole after the overnight swelling period, bail out enough water so that 6 inches of water remains above the gravel (8 inches if measured from the bottom of the hole). Measure the drop in the water level to the nearest 1/16 inch approximately every 30 minutes (Figure 8). If possible, use a percometer to determine the change in water level (Figure 9). A batter board can also be used as a reference point together with a hook gauge to accurately locate the water surface. The hook can be made from stiff wire or an 8d nail. After each measurement, refill the water in the hole so that the liquid depth is 6 inches above the gravel. Continue taking measurements until three consecutive percolation rates vary by a range of no more than 10 percent (see sample field notes, page 7).
- If no water remains in the hole after the overnight swelling period, add 6 inches of clear water above the gravel. Measure the drop in the liquid level to the nearest 1/16 inch approximately every 30 minutes. After each measurement, refill the water to a depth of 6 inches above the gravel. Continue the water level drop measurements until three consecutive percolation rates vary by no more than 10 percent.
- In sandy soils, or other soils in which the first 6 inches of water seep away in less than 30 minutes after the overnight swelling period, allow about 10 minutes between measurements. On some very sandy soils, use a stop watch and measure the time in seconds for the water level to drop from 6 to 5 inches (Figure 10). Refill the percolation test hole after each measurement to bring water to 6 inches above the gravel. Continue taking readings until three consecutive percolation rates vary by no more than 10 percent.
7. Calculate percolation rate
- Divide the time interval by the drop in water level to determine the percolation rate in minutes per inch (MPI). Examples:
- If the drop in water level is 5/8 inch in 30 minutes, the percolation rate is
- If the drop is 2 1/2 inches in 10 minutes, then the percolation rate is
Calculate the percolation rate for each reading (see sample field notes). When three consecutive percolation rates vary by no more than 10 percent, use the average value of these readings to determine the percolation rate for the test hole. Percolation rates determined for each test hole should be averaged in order to determine the design percolation rate. For reporting the percolation rate, worksheets showing all measurements and calculations should be submitted with the site evaluation report. You can reproduce the blank form on the back page of this folder for use in recording percolation test data.
Note that a percolation test should not be run where frost exists in the soil below the depth of the proposed sewage treatment system.
- If the drop in water level is 5/8 inch in 30 minutes, the percolation rate is
8. Determine the trench bottom area
Table 1 shows sewage flows and soil treatment areas. The amount of trench bottom area required depends on the texture of the soil as measured by the percolation rate, the daily sewage flow, and the depth of rock placed below the distribution pipe.
The daily amount of sewage wastes must be estimated in order to size the soil treatment unit. For residences, the daily amount of sewage flow is based on the number of bedrooms and the type of residence. A luxury, three-bedroom house likely will generate more sewage than a more modest house. Sewage flows for different types of houses can be estimated from Table 1. Using a large sewage flow provides a factor of safety in sizing the soil treatment unit. Also consider future house expansion.
Table 1: Sewage flows and soil treatment areas
| Number of bedrooms | Type I | Type II | Type III | Type IV |
|---|---|---|---|---|
| 2 | 300 | 225 | 180 | 60% of values in Type I, II or III columns |
| 3 | 450 | 300 | 218 | 60% of values in Type I, II or III columns |
| 4 | 600 | 375 | 256 | 60% of values in Type I, II or III columns |
| 5 | 750 | 450 | 294 | 60% of values in Type I, II or III columns |
| 6 | 900 | 525 | 332 | 60% of values in Type I, II or III columns |
| 7 | 1050 | 600 | 370 | 60% of values in Type I, II or III columns |
| 8 | 1200 | 675 | 408 | 60% of values in Type I, II or III columns |
aType I residence: The total floor area of the residence divided by the number of bedrooms is more than 800 sq. ft. per bedroom, or more than two of the following water-use appliances are installed—automatic washer, dishwasher, water softener, garbage disposal, jacuzzi or humidifier in furnace.
Type II residence: The total floor area of the residence divided by the number of bedrooms is more than 500 sq. ft. per bedroom, and no more than two of the water-use appliances are installed.
Type III residence: The total floor area of residence divided by the number of bedrooms is less than 500 sq. ft. per bedroom, and no more than two of the water-use appliances are installed.
Type IV residence: No toilet wastes flow into sewage treatment system.
Table 2: Soil treatment areas in square feet
| Percolation rate, minutes per inch | Soil treatment area in square feet per gallon of waste per daya |
|---|---|
| Faster than 0.1b | Soil too coarse for sewage treatmentb |
| 0.1 to 5 | 0.83 |
| 6 to 15 | 1.27 |
| 16 - 30 | 1.67 |
| 31 - 45 | 2.00 |
| 46 to 60 | 2.20 |
| Slower than 60b | Refer to information on mounds |
a For trenches only, the bottom areas may be reduced if more than 6 inches of rock is placed below the distribution pipe; for 12 inches of rock below the distribution pipe the bottom areas can be reduced by 20 percent; a 34 percent reduction for 18 inches; and a 40 percent reduction for 24 inches.
b Soil is unsuitable for standard soil treatment units. Refer to information on mounds and alternative systems.
To illustrate how to use Table 1, determine the amount of trench bottom area required for a three-bedroom, type I dwelling. The soil percolation rate, as measured by the percolation data presented on page 7, is 22.3 MPI. From Table 1, a three-bedroom, type I dwelling is estimated to generate 450 gallons of sewage per day. The trench bottom area required for a percolation rate in the range of 16 to 30 is 1.67 square feet per gallon of waste per day.
Thus, the total required bottom area is 1.67 X 450 = 750 square feet for trenches with 6 inches of rock below the distribution pipe. If 12 inches of rock is used as recommended, the trench bottom area can be reduced by 20 percent (see footnote a, Table 2). The required trench bottom area is then 0.80 X 750 = 600 square feet.
The trench bottom area can be reduced by 34 percent for 18 inches of rock below the distribution pipe and by 40 percent for the maximum rock depth of 24 inches. As rock depth increases the required trench bottom area decreases, because more soil is exposed along the trench sidewall and a greater liquid depth increases the flow through the trench bottom.
The minimum trench width is 18 inches; the maximum width is 36 inches. Using 36-inch wide trenches in the above example, total trench length with 12 inches of rock below the distribution pipe is 200 lineal feet (600 ÷ 3). It is recommended that the 200 lineal feet should be divided into two or more trenches. The sewage effluent should be distributed between the trenches by means of drop boxes
How to determine plastic limit (PL or wP)
Definitions
Plastic Limit (PL or wP) – The minimum water content at which the mixture acts a plastic solid. More information can be found in the Manual for SSTS Professionals in Minnesota, Section 3 - Sewage Treatment Utilizing Soil.
Step-by-step instructions

Procedure for determining plastic limit in the field
- Select a handful of soil for testing (any non-soil material (rocks, roots, etc.) should be removed). Do not add moisture or let dry-out. Sample should be taken at the depth of excavation (absorption area).
- Roll the sample between the palms (in the shape of a pencil/worm shape).
- Continue rolling the thread until it reaches a uniform diameter of 1/8 inch if possible (See Figures 3.23 and 3.24).
- If the sample does not reach a diameter of 1/8 inch, the soil is above the plastic limit and construction can proceed.
- If the sample is rolled into a diameter equal to 1/8 inch before breaking, the soil is too wet and construction should not occur.